|
|
FOUNDED 1993 PIONEERS IN IR-FIBER AND REACTION MONITORING |
|
SYSTEMS
HEADS & REACTORS
SERVICES
SOFTWARE |
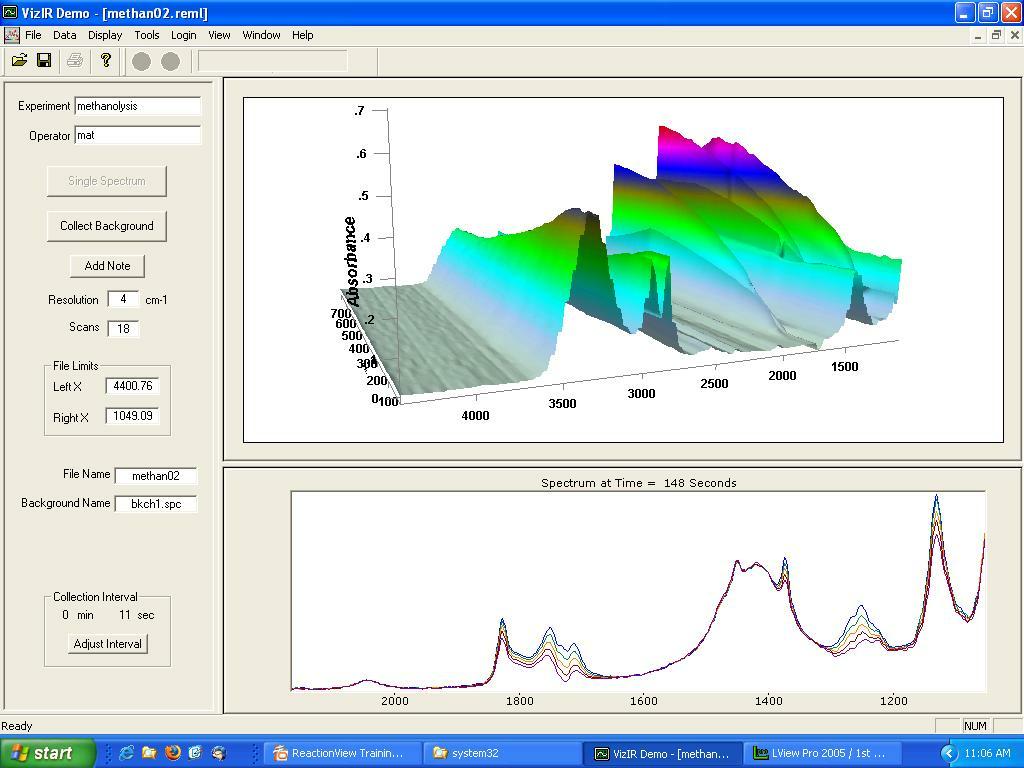 VizIR™ combines data collection, display, and reaction analysis in a single interface which is both simple and powerful. You can collect spectra every 30 seconds or every half hour, set up and save methods for repeat experiments, calculate trend-lines for products and reactants, and examine the 3D data visually in real time. The secondary display can be used to display the most recent spectrum, or the most recent five specta in overlaid or waterfall format. |
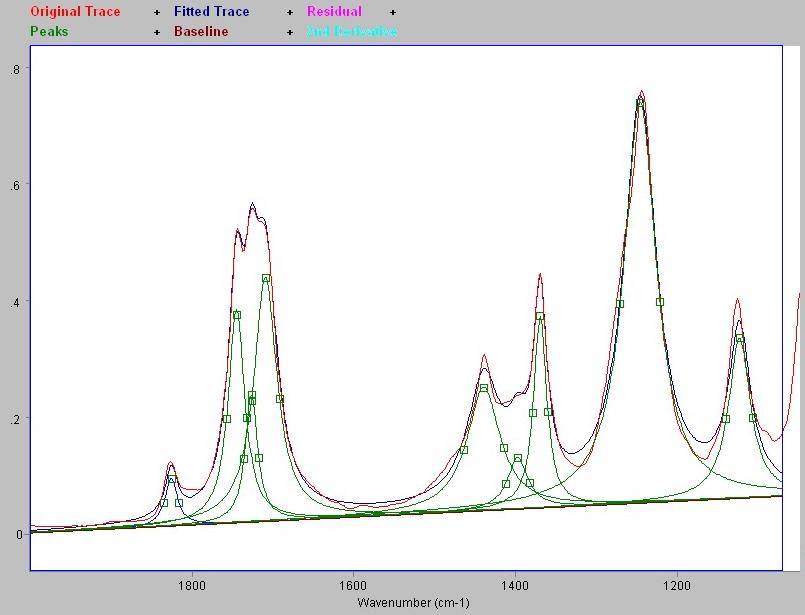
VizIR™ combines a control panel for setting up and running experiments with a toolbox for analyzing spectroscopic reaction data. Simple, well-defined peaks can be tracked using directly measured peak heights, with or without baseline correction. Complex features can be analysed using peak-fitting models created in GRAMS® to deconvolute complex spectra and generate trendlines based on individual peak heights. You can even build a peak-fit model during data collection.
The peak-fit model is built using a visual interface to insert peaks. The position, width, and height of peaks can be fixed or constrained as needed. |
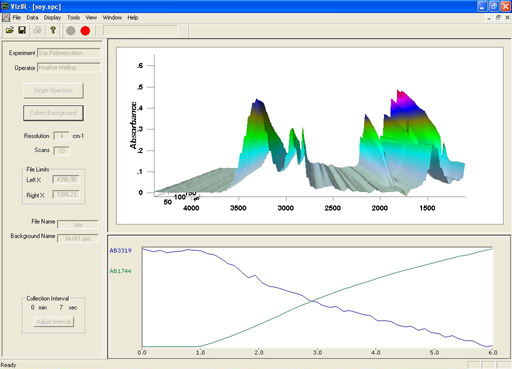 Trend-lines based on simple peak heights or on peak-fit models can be displayed in the secondary window.There is no limit on the number of trend-lines that you can calculate and save. The real-time display is limited to five lines at a time, and each line is autoscaled in the display. When data collection is ended, VizIR™ trend-lines are automatically saved in a text format that can be easily imported into a spreasheet for display or for additional reaction-analysis calculations. |
|
|
Mobile Site |
© 2022, Remspec |
This Site is Hosted on a RimuHosting VPS |